
Welcome to
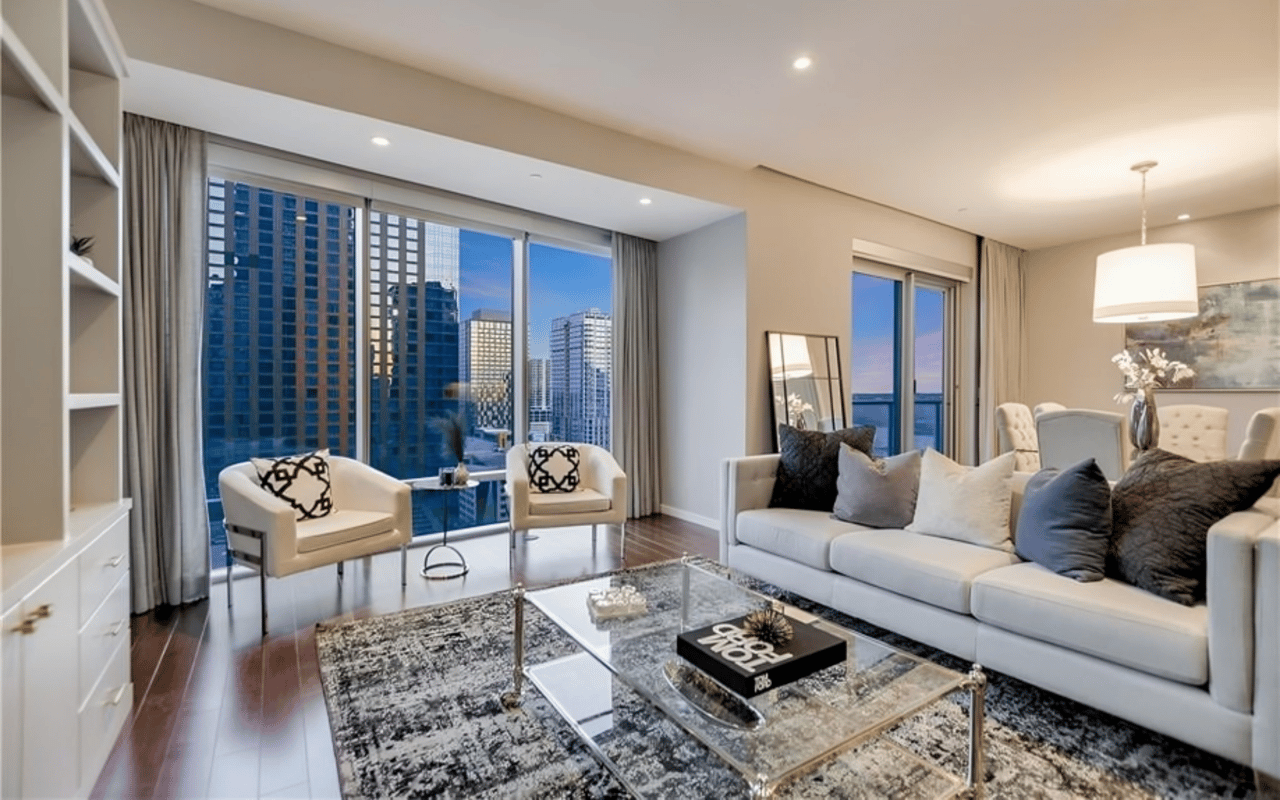
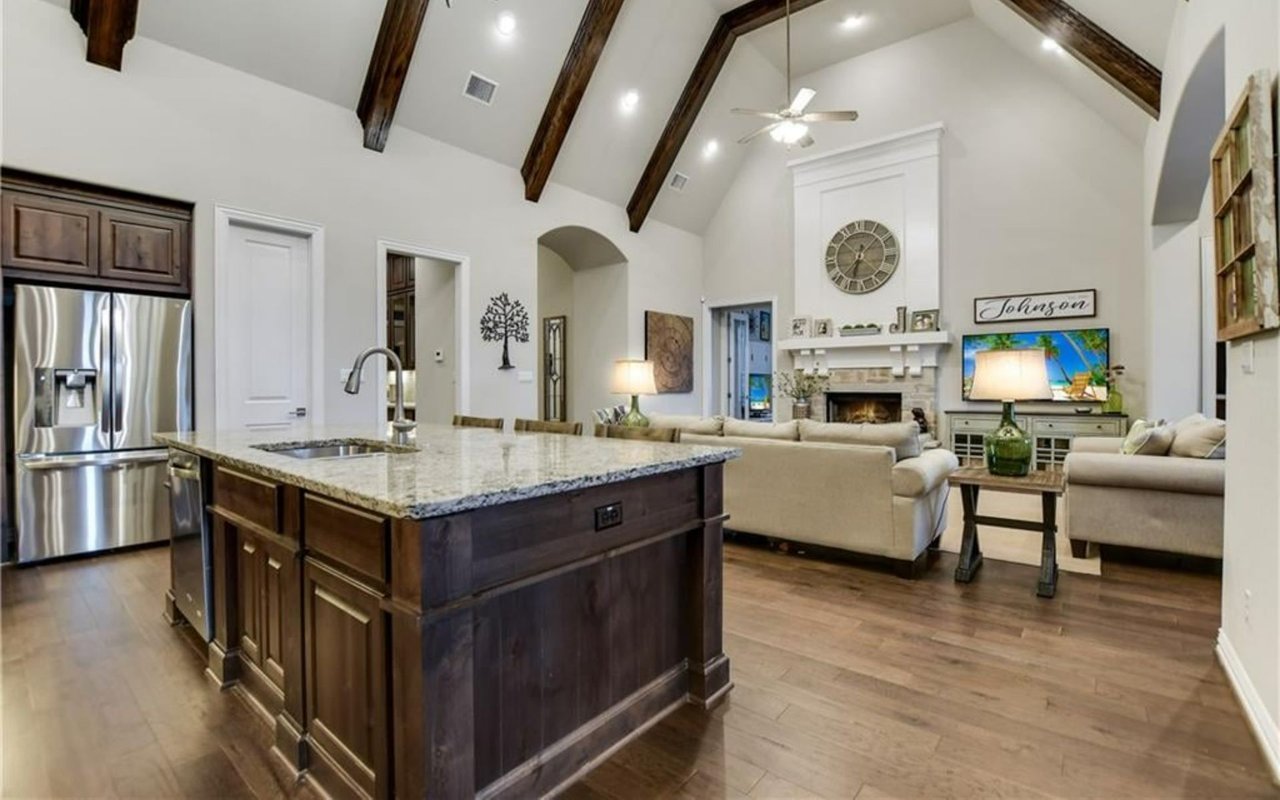
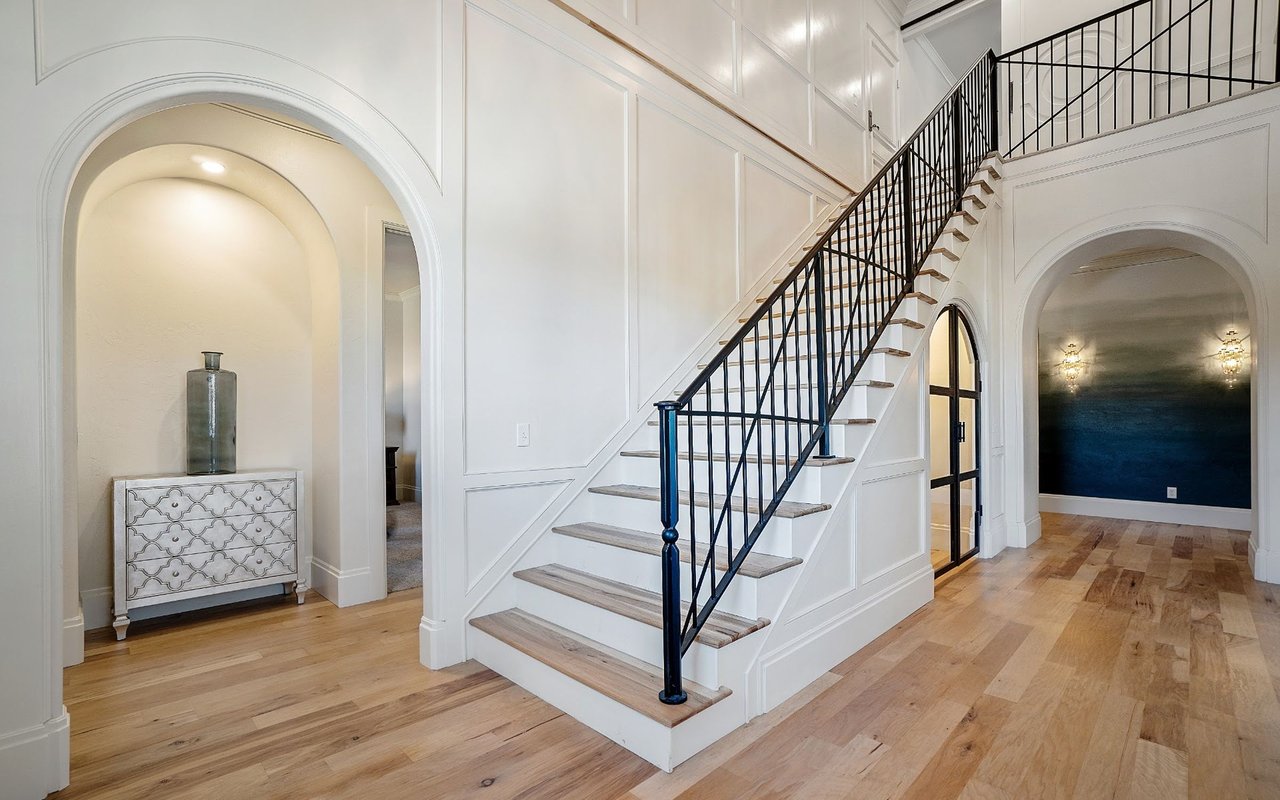
Luxury Dripping Springs, TX Real Estate & Lifestyle
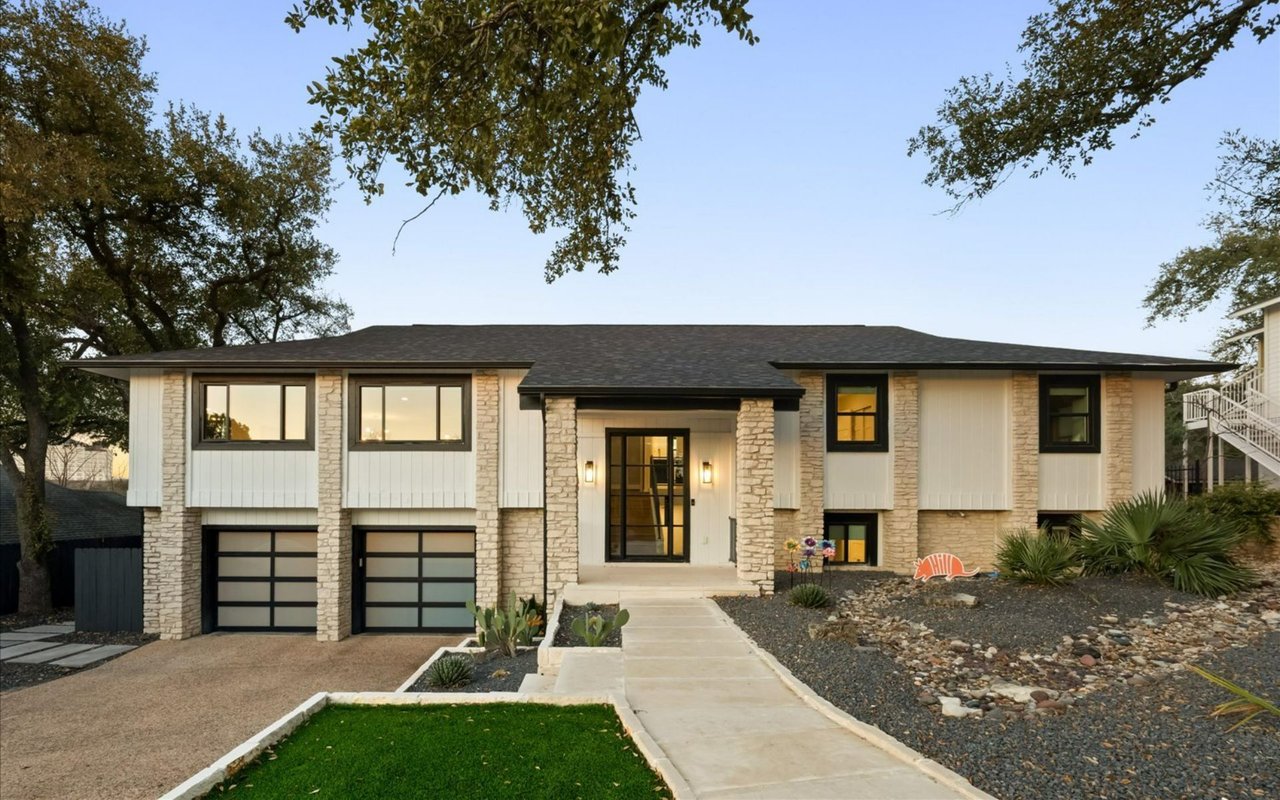
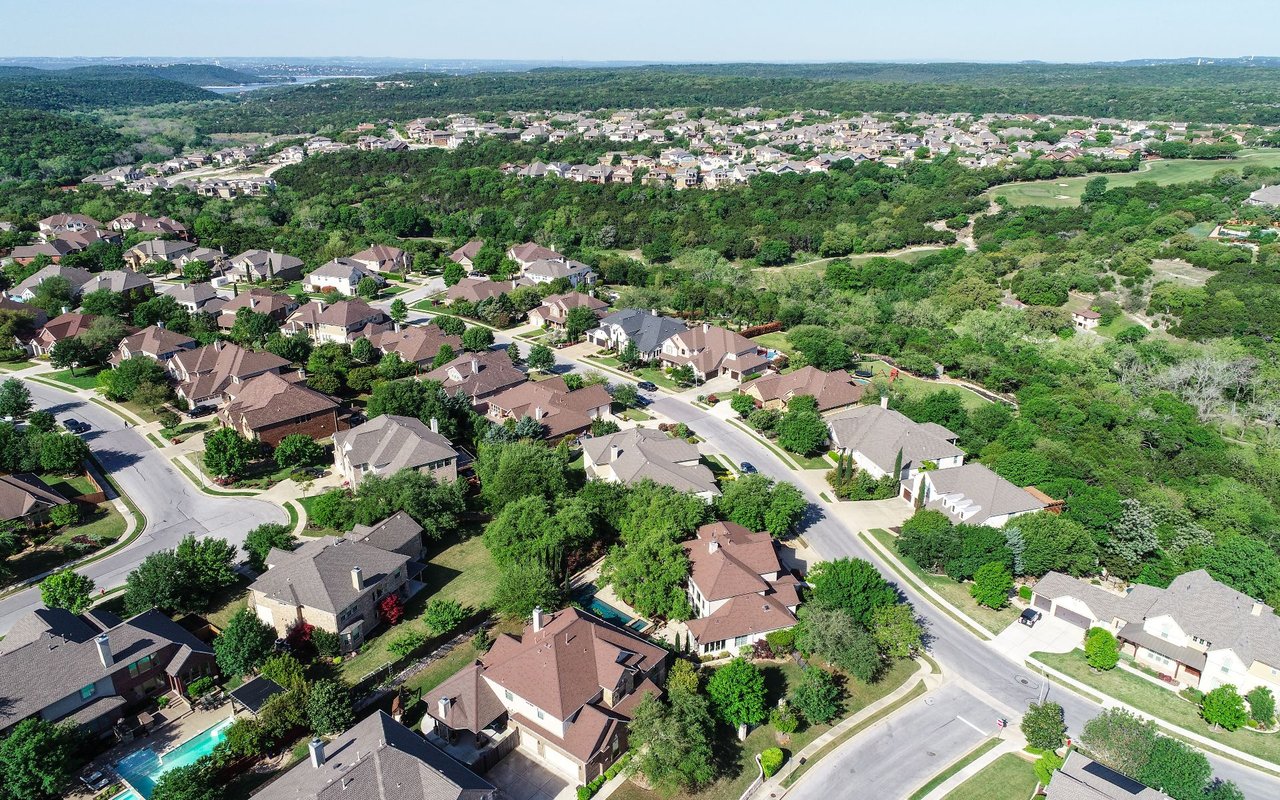
Just 30 minutes southwest of Downtown Austin lies an area known as the Gateway to the Hill Country.
Just 30 minutes southwest of Downtown Austin lies an area known as the Gateway to the Hill Country. Dotted with wineries, breweries, large acreage homesites on rolling hills, this is where one goes to unwind from the big city and enjoy fresh air, wide-open spaces, heritage oak trees, and multiple newer subdivisions and excellent Dripping Springs ISD.
20,624 people live in Dripping Springs, where the median age is 42.7 and the average individual income is $66,927. Data provided by the U.S. Census Bureau.
Total Population
Median Age
Population Density
Average individual Income
There's plenty to do around Dripping Springs, including shopping, dining, nightlife, parks, and more. Data provided by Walk Score and Yelp.
Explore popular things to do in the area, including Pure Water Stop, Fancy Eats & Sweets, and Jean Jacques Machado - Austin.
| Name | Category | Distance | Reviews |
Ratings by
Yelp
|
|---|---|---|---|---|
| Dining · $ | 3.5 miles | 10 reviews | 5/5 stars | |
| Dining | 1.62 miles | 8 reviews | 5/5 stars | |
| Active | 1.14 miles | 9 reviews | 5/5 stars | |
| Active | 2.88 miles | 5 reviews | 5/5 stars | |
| Active | 3.34 miles | 7 reviews | 5/5 stars | |
| Beauty | 3.07 miles | 5 reviews | 5/5 stars | |
| Beauty | 3.42 miles | 11 reviews | 5/5 stars | |
| Beauty | 3.45 miles | 6 reviews | 5/5 stars | |
| Beauty | 3.63 miles | 15 reviews | 5/5 stars | |
|
|
||||
|
|
||||
|
|
||||
|
|
||||
|
|
||||
|
|
Dripping Springs has 7,531 households, with an average household size of 2.73. Data provided by the U.S. Census Bureau. Here’s what the people living in Dripping Springs do for work — and how long it takes them to get there. Data provided by the U.S. Census Bureau. 20,624 people call Dripping Springs home. The population density is 117 and the largest age group is Data provided by the U.S. Census Bureau.
Total Population
Population Density Population Density This is the number of people per square mile in a neighborhood.
Median Age
Men vs Women
Population by Age Group
0-9 Years
10-17 Years
18-24 Years
25-64 Years
65-74 Years
75+ Years
Education Level
Total Households
Average Household Size
Average individual Income
Households with Children
With Children:
Without Children:
Blue vs White Collar Workers
Blue Collar:
White Collar:


3933 Steck Ave Ste B110 Austin, TX 78759
3933 Steck Ave Ste B110 Austin, TX 78759